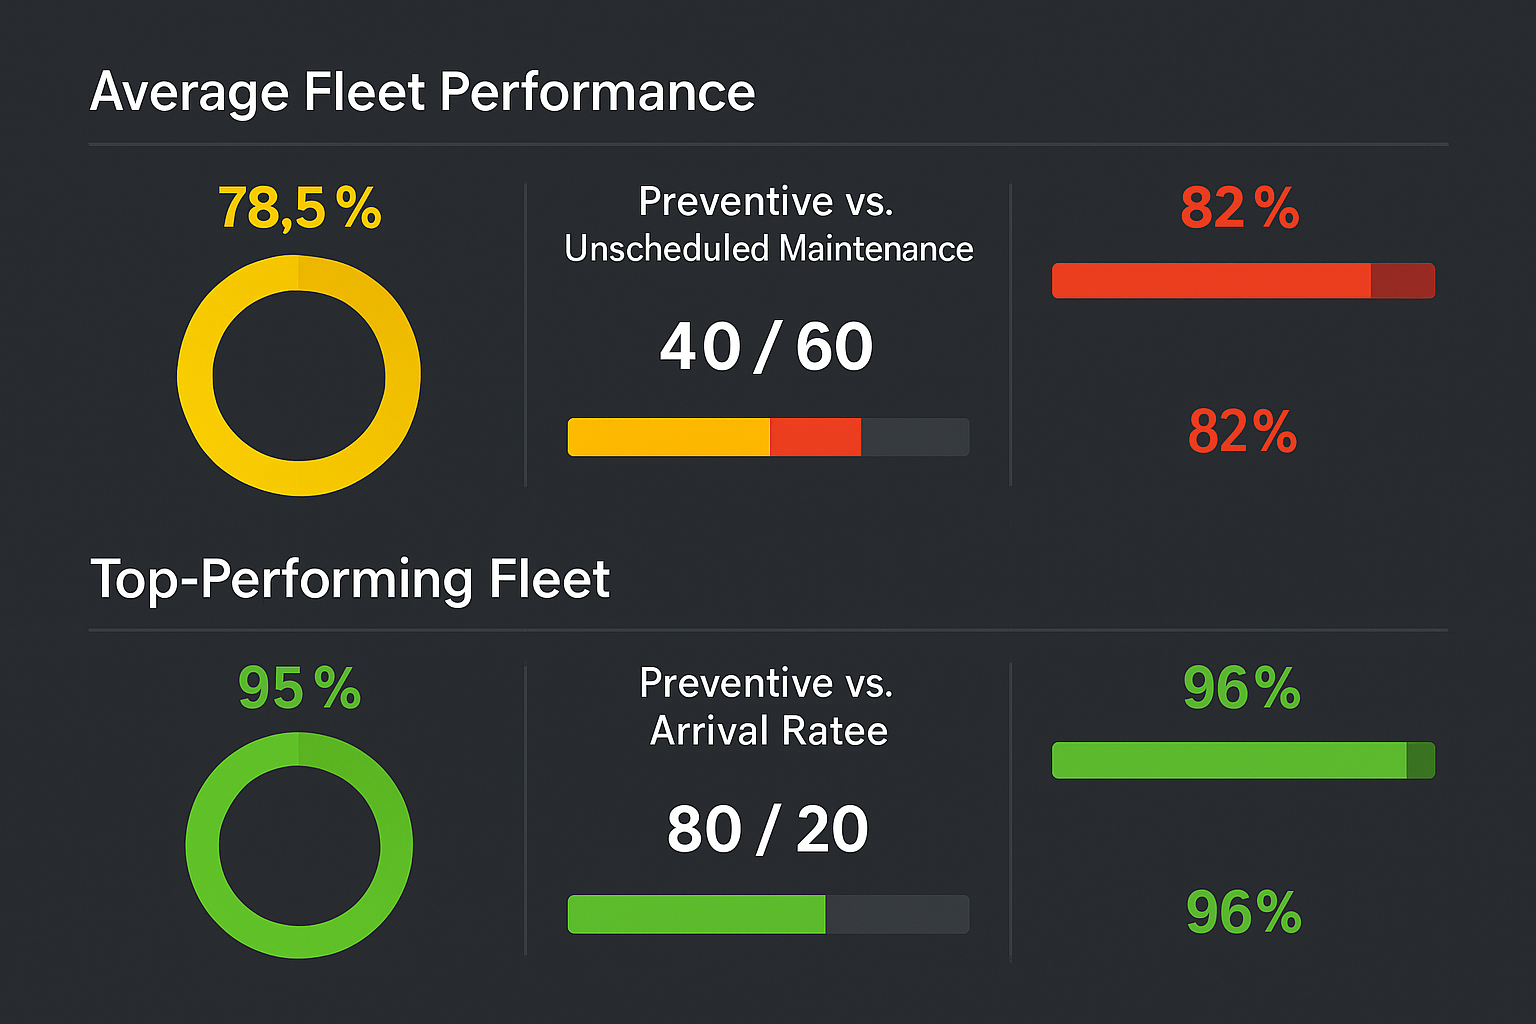

Discover the exact fleet KPIs top-performing companies use to dramatically reduce costs and increase efficiency. Our data-driven report reveals the metrics that actually move the needle.
Fleet managers implementing our KPI framework report 15-20% reduction in operating costs and measurable improvements in 4-6 weeks.

We analyzed data from 1,000+ transportation professionals to identify the KPIs that separate average fleets from industry leaders.
Our research reveals significant differences in KPI targets across fleet types. Know exactly where your fleet should be performing:
| KPI Metric | Trucking/Logistics Fleet | Service/Field Fleet |
|---|---|---|
| Fuel Economy (MPG) | ~6.5–7.0 MPG (Class 8 trucks) | ~17–18 MPG (light-duty service vans) |
| Operating Cost per Mile | $0.31 per mile (excl. driver) | $0.17 per mile (excl. driver) |
| On-Time Performance | ~78–85% (parcel last-mile) | ≥90% (service calls target) |
| Annual Driver Turnover | ~90% (long-haul carriers) | ~20% (private/service fleets) |
"I've used several fleet software systems in my 15 years in the industry. EasiTrack stands above the rest for KPI tracking and optimization. We increased our PM compliance by 35% in one quarter."
Fleet Director, Regional Transport Co."The benchmarks in this report helped us identify exactly where we were falling short. We've cut maintenance costs by 23% by focusing on the right KPIs."
Operations Manager, Field Service Inc.Download the complete research study with actionable insights you can implement today.
By submitting this form, you agree that we may contact you by phone, email, or SMS about our services. You can opt-out anytime. See our Terms of Use and Privacy Policy.